
Chart Observations
1. Price Action
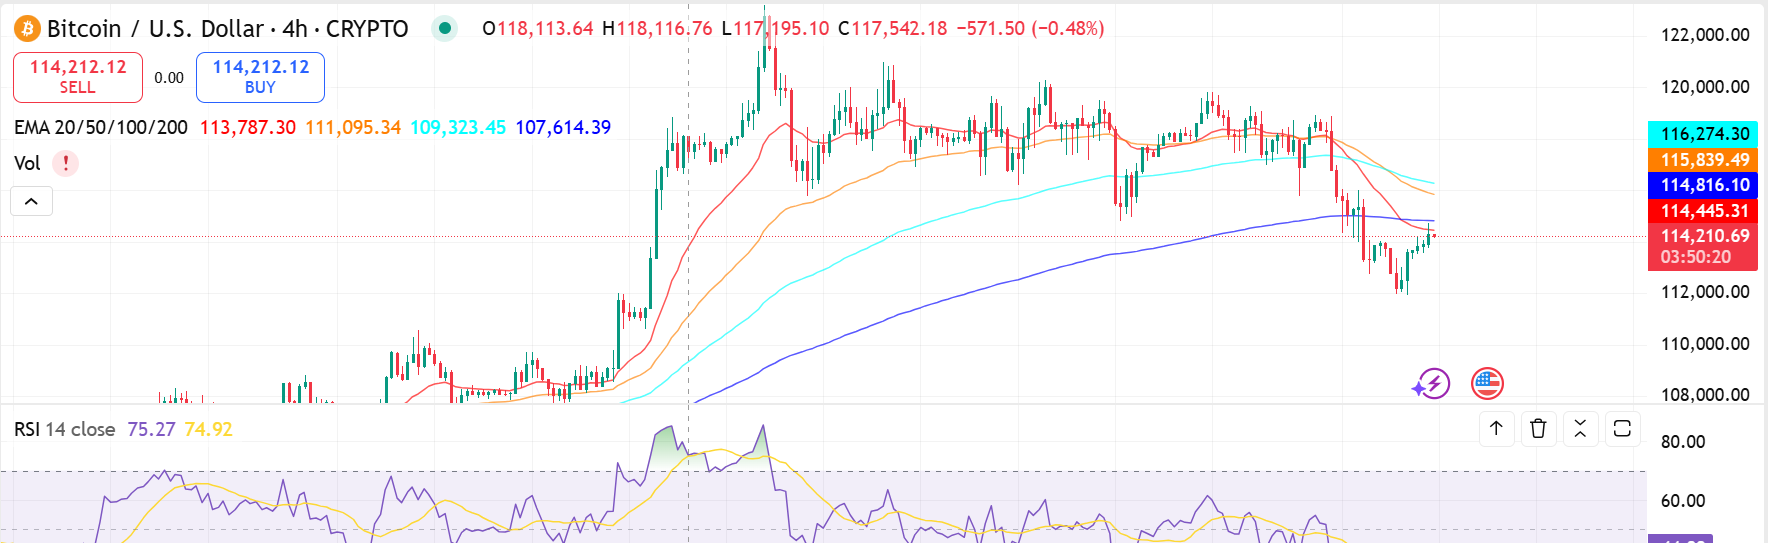
- The price has recently bounced from a local low around $112,000 and is now testing resistance near the 200-day moving average (the blue line, around $114,800).
- This move upward follows a steep downtrend, but recent candles suggest short-term recovery or a relief rally.
2. Moving Averages (MA)
- The price is below the 50-day and 100-day moving averages (red and orange lines), indicating a macro bearish trend.
- However, it’s now testing the 200-day MA as resistance, which is critical.
- If BTC breaks above and closes above the 200-day MA, it could signal a short-term trend reversal.
- Failure to close above it may result in a continuation of the downtrend.
3. RSI (Relative Strength Index)
- RSI is currently around 43.83, slightly below neutral (50).
- It’s rising from an oversold region, suggesting that momentum is recovering, but not yet strong.
- RSI divergence is not clearly visible, so no strong reversal signal yet.
Probable Scenarios
✅ Bullish Probability (~40%)
- Conditions:
- Price breaks above $114,800–$115,000 (200-day MA) with volume.
- RSI crosses above 50 indicating momentum confirmation.
- Target Zones:
- $117,800 (recent local high)
- $120,000 resistance
⚠️ Neutral/Sideways Probability (~30%)
- Conditions:
- Price consolidates between $112,000–$115,000, forming a range.
- No clear RSI or MA breakout.
- Implication:
- Traders remain indecisive; market awaits a catalyst (macro news, FOMC, ETF flows, etc.)
🔻 Bearish Probability (~30%)
- Conditions:
- Rejection from 200-day MA
- Break back below $112,000
- RSI fails to break above 50 and turns down
- Downside Targets:
- $108,000 (previous support zone)
- $105,000 or lower if sentiment weakens
Conclusion
BTC/USD is at a critical decision point:
- A bullish breakout above $115,000 may fuel a rally.
- But failing to hold above the 200-day MA increases the chance of a retest of $112K and below.
Traders should wait for confirmation via:
- Volume support on breakouts
- RSI crossing above 50
- Clear candlestick patterns (e.g., engulfing or hammer near support/resistance)
Disclaimer: This is not financial advice. Market conditions can change rapidly; always use risk management.