

Chart Overview and Context
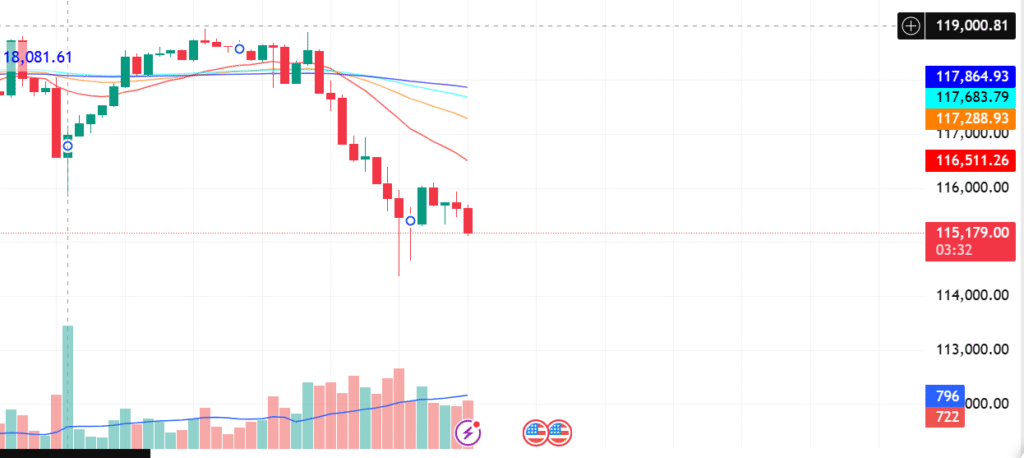
The chart shows a solid downtrend in the 1-hour time frame. The current price is near ₹115,179. In this case, all exponential moving averages (EMAs) 20, 50, 100, and 200 are in a bearish arrangement. The EMA 20 is positioned below the EMA 50, which is below EMA 100 and EMA 200. This confirms that the market is in a downtrend. Also, price action shows selling pressure with lower highs and lower lows.
There has been no notable increase in volume, however, the red candles are being supported by steady or slightly increasing volume. This suggests that the bears are currently in control. There is a recent rejection wick near the swing low which indicates that buyers have tried to step in but were unable to hold control.
Indicator Value Interpretation
EMA 20 ₹116,511 Most Nearby Dynamic Level Resistance
EMA 50 ₹117,288 Mid Level Resistance
EMA 100 / 200 ₹117,683 – ₹117,864 Resistance Zone Long Term
Price Location ₹115,179 Remaining Below All EMAs Price Location
Volume Moderate to rising on red candles Continued Bearish Pressure in Volume
Price Action and Market Structure
The price action recently broke down from a small consolidation area around ₹118,000. Following this, the candles show strong bearish momentum, where each bullish candle gets weaker and the next bearish candle pushes down harder. Recent lows show rejection wicks, signaling buying attempts to reverse the downtrend. Despite these attempts, the buying pressure has not been strong enough to reverse the structure. It maintains the lower highs and lower lows sequence.
Swing Levels
Swing High (Resistance):
The last swing high comes in around ₹117,864, which is in line with 200 EMA. This is a strong reversal zone where the sellers started dominating the price action, and hence the zone is marked with strong resistance.
Swing Low (Support):
The most recent support area now lies in the range of ₹115,000 and ₹114,700. A prior red candle breached this area but closed above, demonstrating attempts from the buyers to this zone.
Potential Trade Setups
- Breakdown Trade (Bearish Continuation)
This particular setup would trigger when the price breaks down past the ₹115,000 support level with a candle close confirmation and volume increase.
Entry: Below ₹114,950
Targets: ₹114,200 and ₹113,000
Stop Loss: ₹115,600 and above
Probability: High, as the bearish trend continues.
- Pullback Entry (Mean Reversion)
The price is likely to retest the 20 EMA, which is situated at around ₹116,500. If the price is rejected there, it will set up another opportunity to go short in line with the trend.
Entry: ₹116,400 to ₹116,600 following rejection candlestick
Targets: ₹115,200 and ₹114,500
Stop Loss: ₹116,900 and above
Probability: Medium to high, as long as the price doesn’t pull back aggressively.
- Aggressive Countertrend Long
An aggressive long position could be possible if a strong bullish engulfing candle forms around ₹115,000. This is a high-risk move and would only be appropriate for scalpers.
Entry: Above ₹115,500 with bullish confirmation
Targets: ₹116,000 and ₹116,400
Stop Loss: Below ₹114,800
Probability: Low; the overall trend is bearish, proceed with caution
Risk Management Notes
Ensure the risk-reward ratio is 1:2 or better
Confirmed candle closes below or above significant levels should be waited on
Overtrading against the prevailing trend is discouraged without compelling reversal signals.
Confirmation from other indicators like RSI, MACD, or divergence should be taken into account.
Final Bias
The current market structure, EMA alignment, and volume behavior indicates bearish. Most reliable setups are breakdown below support or pullback rejections near EMA 20. Avoid counter trend trades unless appealing reversal patterns are strongly confirmed.